The problem
Pick a route. Compare the fastest and slowest full runs.
Same line, weekday timetable. The gap is how much longer a “bad” trip is allowed to take—and where schedule padding shows up.
Scheduled run time · —
—
The fix
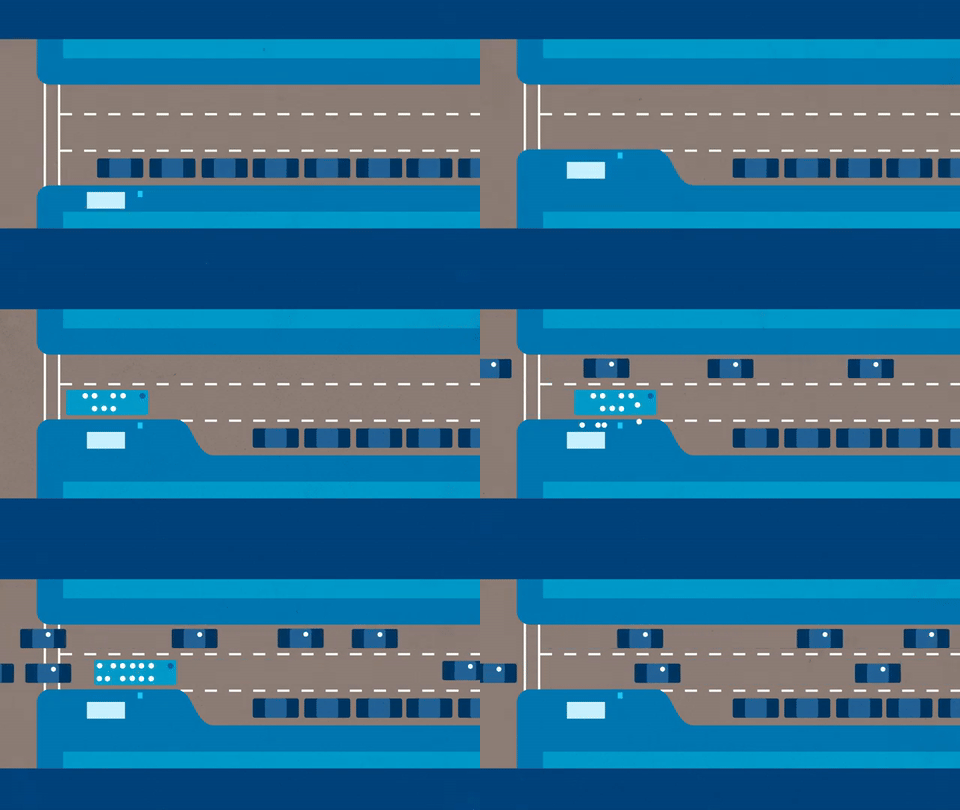
Price bus bulbs on that route.
Assume bulbs at the busiest stops. Research often credits about 15–30 seconds per visit from skipping the curb pull-in and merge.
-
1. Total capital cost—
-
2. Annual operating savings—
-
3. Return on investment in time—
Operating savings are capacity value, not automatic cash. They become budget savings when enough time is cut from schedules to reduce recovery time, overtime, or buses needed.
Where bus bulbs could go
—
Starts with the most frequently served stops. Each direction counts as a separate stop.
All routes
Where the schedule gap is biggest.
Largest gap between fastest and slowest full weekday runs in either direction. Click a row to inspect that route.
| Route | Direction | Time between fastest & slowest | % increase potential |
|---|
04 · Method & sources
How the numbers are built.
slowest full run − fastest full run (minutes, %, first-stop departures)selected stops × cost per bulbweekday visits × seconds ÷ 3,600 (sec → hours) × 255 (weekdays / year) × NTD $/hourcapital ÷ annual operating savingsService: SFMTA GTFS weekday schedule. Full runs = the longest stop pattern that appears at least five times per direction (short-turns excluded).
Operating costs: 2024 NTD SFMTA profile — $301.60 / motor-bus revenue-hour, $281.30 / trolleybus.
Bus-bulb effect: Default 20 seconds sits in the 15–30 second range (FHWA-NJ-2003-015); see also NACTO and TCRP Report 65.
Capital cost: Planning range about $15,000–$70,000 per bulb (PEDSAFE). Default $40,000.
SFMTA GTFS derivative notice: Reproduced with permission granted by the City and County of San Francisco. The information is provided “as is,” without warranty. Data provided by SFMTA / City and County of San Francisco.